
The size of the graphics are the standard sizes which are defined from the programs
| Code | OctPlot 0.3.6 | |
| Pareto-Plot x = [1 10 4 20]; y = {'one','ten','four','twenty'}; h = pareto(x,y); set(gcf,'Color','w'); print -dpng -r72 'paretoName.png' |

|
|
| Comment | ||
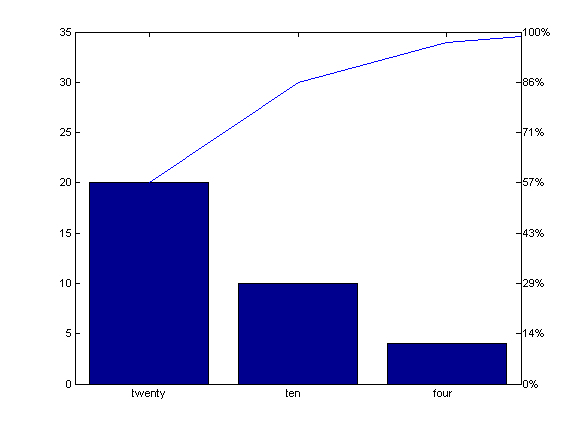
| Code | Matlab R14SP3 | |
| Pareto-Plot x = [1 10 4 20]; y = {'one','ten','four','twenty'}; h = pareto(x,y); set(gcf,'Color','w'); print -dpng -r72 'paretoName.png' |
|
|
| Comment | 'one' is missing?? |