
The size of the graphics are the standard sizes which are defined from the programs
| Code | OctPlot 0.3.99 | |
| Quiver-Plot [x,y] = meshgrid(-2:0.1:2); z = x.*exp(-x.^2-y.^2); [dx,dy] = gradient(z,0.1,0.1); quiver(x,y,dx,dy) set(gca,"color","w"); print -dpng -r72 'quiverName.png' |
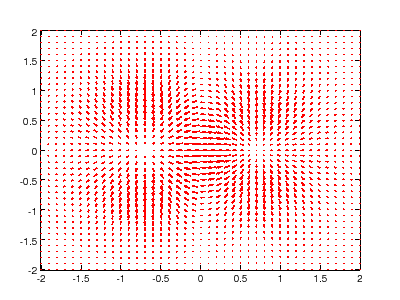
|
|
| Comment | ||
| Code | Matlab R14SP3 | |
| Quiver-Plot [x,y] = meshgrid(-2:0.1:2); z = x.*exp(-x.^2-y.^2); [dx,dy] = gradient(z,0.1,0.1); quiver(x,y,dx,dy) set(gca,'color','w'); print -dpng -r72 'quiverName.png' |
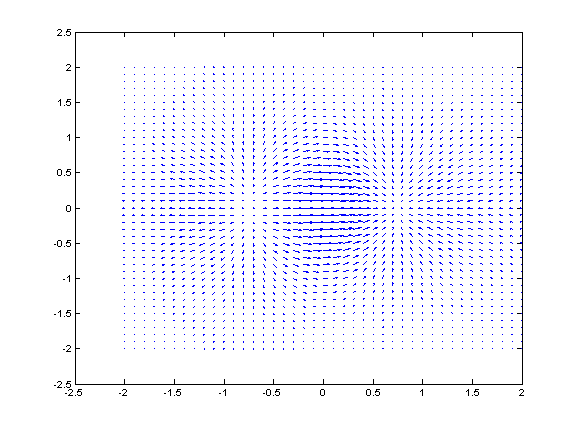
|
|
| Comment |