
The size of the graphics are the standard sizes which are defined from the programs
| Code | OctPlot 0.3.5 | |
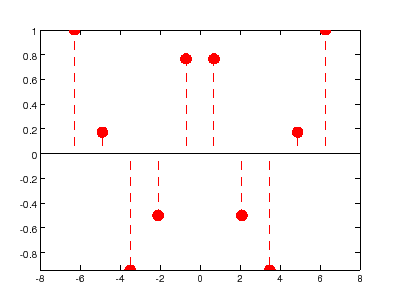
| Stem-Plot t = linspace(-2*pi,2*pi,10); h = stem(t,cos(t),'fill','--'); set(gcf,'Color','w') print -dpng -r72 'stemName.png' |
|
|
| Comment | no comment |
|
| Code | Matlab R14SP3 | |
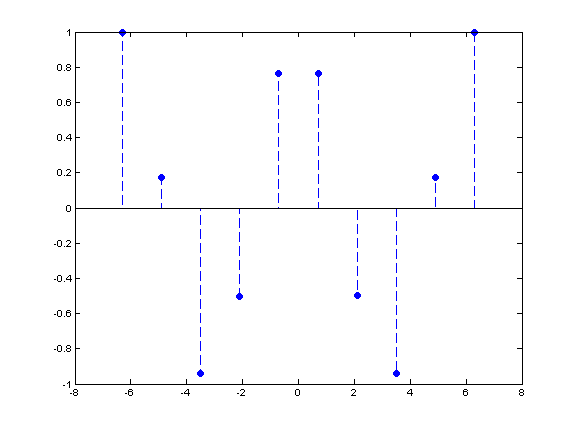
| Stem-Plot t = linspace(-2*pi,2*pi,10); h = stem(t,cos(t),'fill','--'); set(gcf,'Color','w') print -dpng -r72 'stemName.png' |
|
|
| Comment | no comment |