
The size of the graphics are the standard sizes which are defined from the programs
| Code | OctPlot 0.3.5 | |
| subplot x = -2.9:0.2:2.9; subplot(2,2,1); bar(x,exp(-x.*x),[0.2 0.2 1]); set(gca,'XLim',[-2.5 2.5]); subplot(2,2,2); stem(x,exp(-x.*x),"fill",'m'); set(gca,'XLim',[-2.5 2.5]); subplot(2,2,3); plot(x,exp(-x.*x),"r-"); set(gca,'XLim',[-2.5 2.5]); subplot(2,2,4); x = 1:5; pie(x); set(gcf,'Color','w'); print -dpng -r72 'subplotName.png' |

|
|
| Comment | no comment |
|
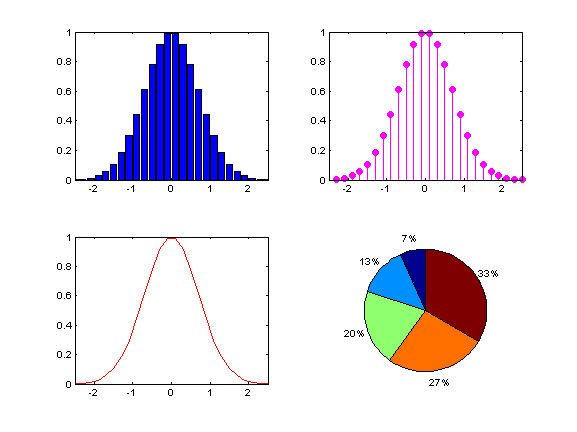
| Code | Matlab R14SP3 | |
| subplot x = -2.9:0.2:2.9; subplot(2,2,1); bar(x,exp(-x.*x),'b'); set(gca,'XLim',[-2.5 2.5]); subplot(2,2,2); stem(x,exp(-x.*x),'fill','m'); set(gca,'XLim',[-2.5 2.5]); subplot(2,2,3); plot(x,exp(-x.*x),"r-"); set(gca,'XLim',[-2.5 2.5]); subplot(2,2,4); x = 1:5; pie(x); set(gcf,'Color','w'); print -dpng -r72 'subplotName.png' |
|
|
| Comment | Doesn't support double quotes and for bar-plots, no rgb-tripl colors allowed. |