
The size of the graphics are the standard sizes which are defined from the programs
| Code | OctPlot 0.3.0 | |
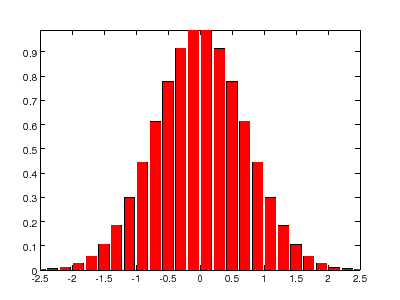
| Bar-Plot x = -2.9:0.2:2.9; bar(x,exp(-x.*x)) set(gcf,'Color','w') set(gca,'XLim',[-2.5 2.5]) print -dpng -r72 'barName.png' |
|
|
| Comment | no comment |
|
| Code | Matlab R14SP3 | |
| Bar-Plot x = -2.9:0.2:2.9; bar(x,exp(-x.*x)) set(gcf,'Color','w') set(gca,'XLim',[-2.5 2.5]) print -dpng -r72 'barName.png' |

|
|
| Comment | no comment |