Feature-Request
For missing 2D graphs use the feature-request page on sourceforge.
3D support will follow after the release 1.0.0. See for more infos the road map site.
Matlab compatibility
Comparison between Matlab© R14SP3 and the actual OctPlot version.
Command comparison
| Plot Command | OctPlot | Matlab R14SP3 |
| bar |
+ [r g b] color definitions possible |
- [r g b] color not possible |
| barh |
+ [r g b] color definitions possible |
- [r g b] color not possible |
| pareto | no comments | no comments |
| quiver | comparison to MATLAB(TM) not done till yet | see column "OctPlot" |
| stairs | comparison to MATLAB(TM) not done till yet | see column "OctPlot" |
| stem | no comments | no comments |
| subplot |
- missing 'replace' - missing 'align' - missing 'Position',[left bottom width height] |
no comments |
Graphics comparison
click on the picture to enlarge it.
| Plot Command | OctPlot | Matlab R14SP3 |
| bar |
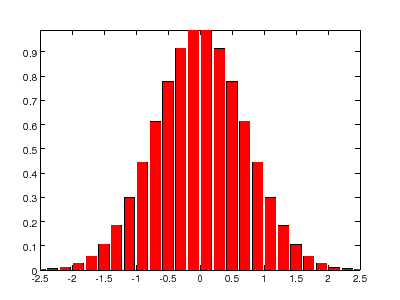 |
 |
| barh |
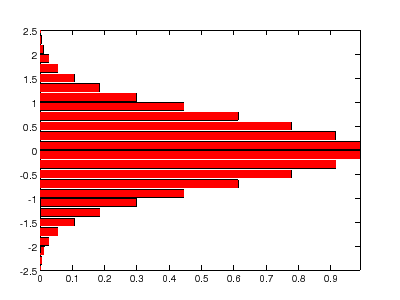 |
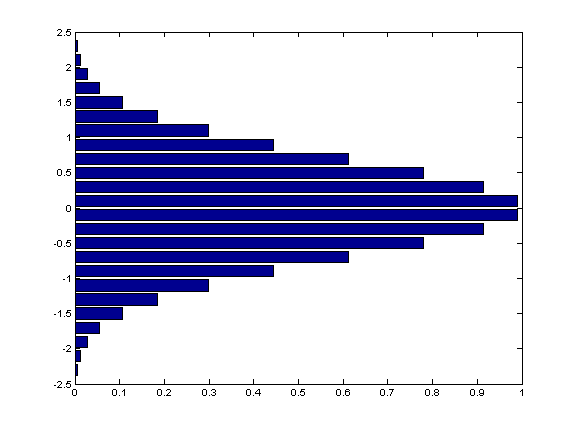 |
| pareto |
 |
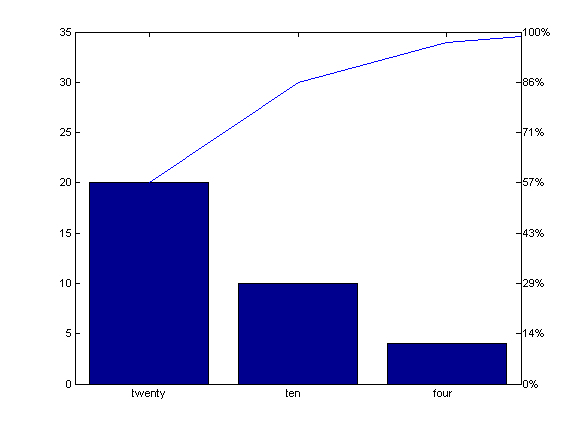 |
| quiver |
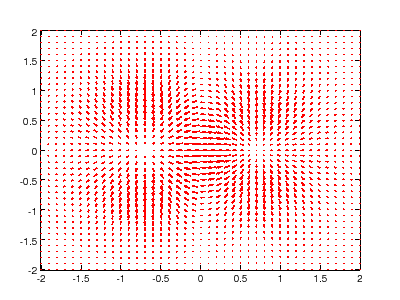 |
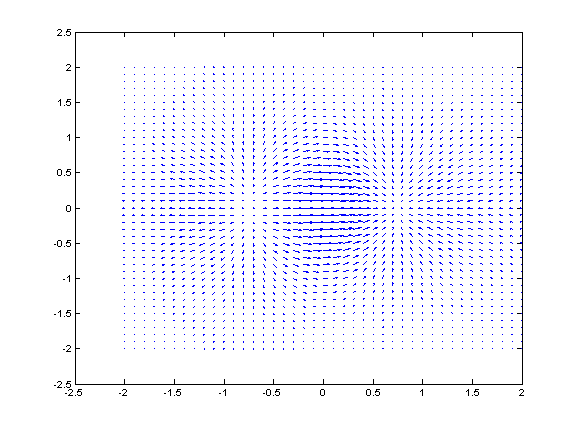 |
| stairs |
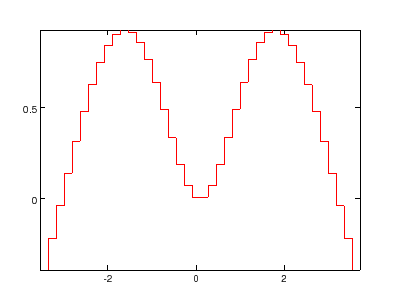 |
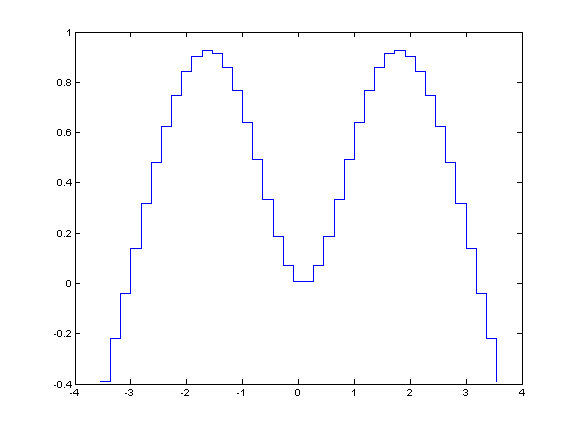 |
| stem |
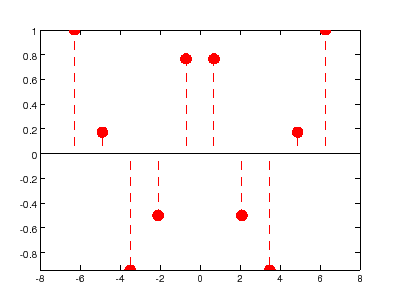 |
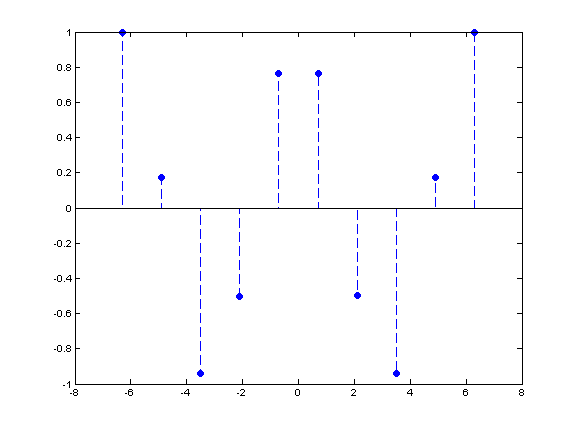 |
| subplot |
 |
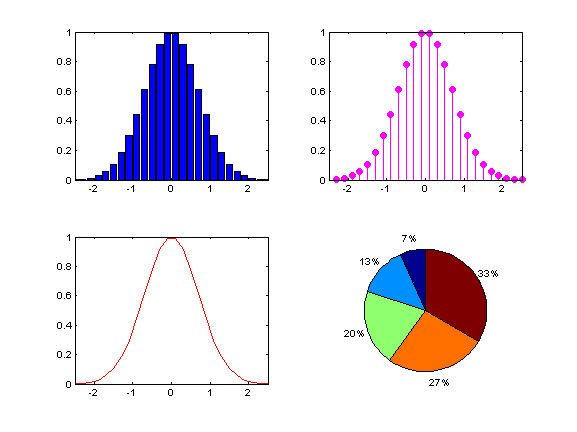 |
